PACIFIC DATAVIZ CHALLENGE 2026
When Water Changes, Everything Changes
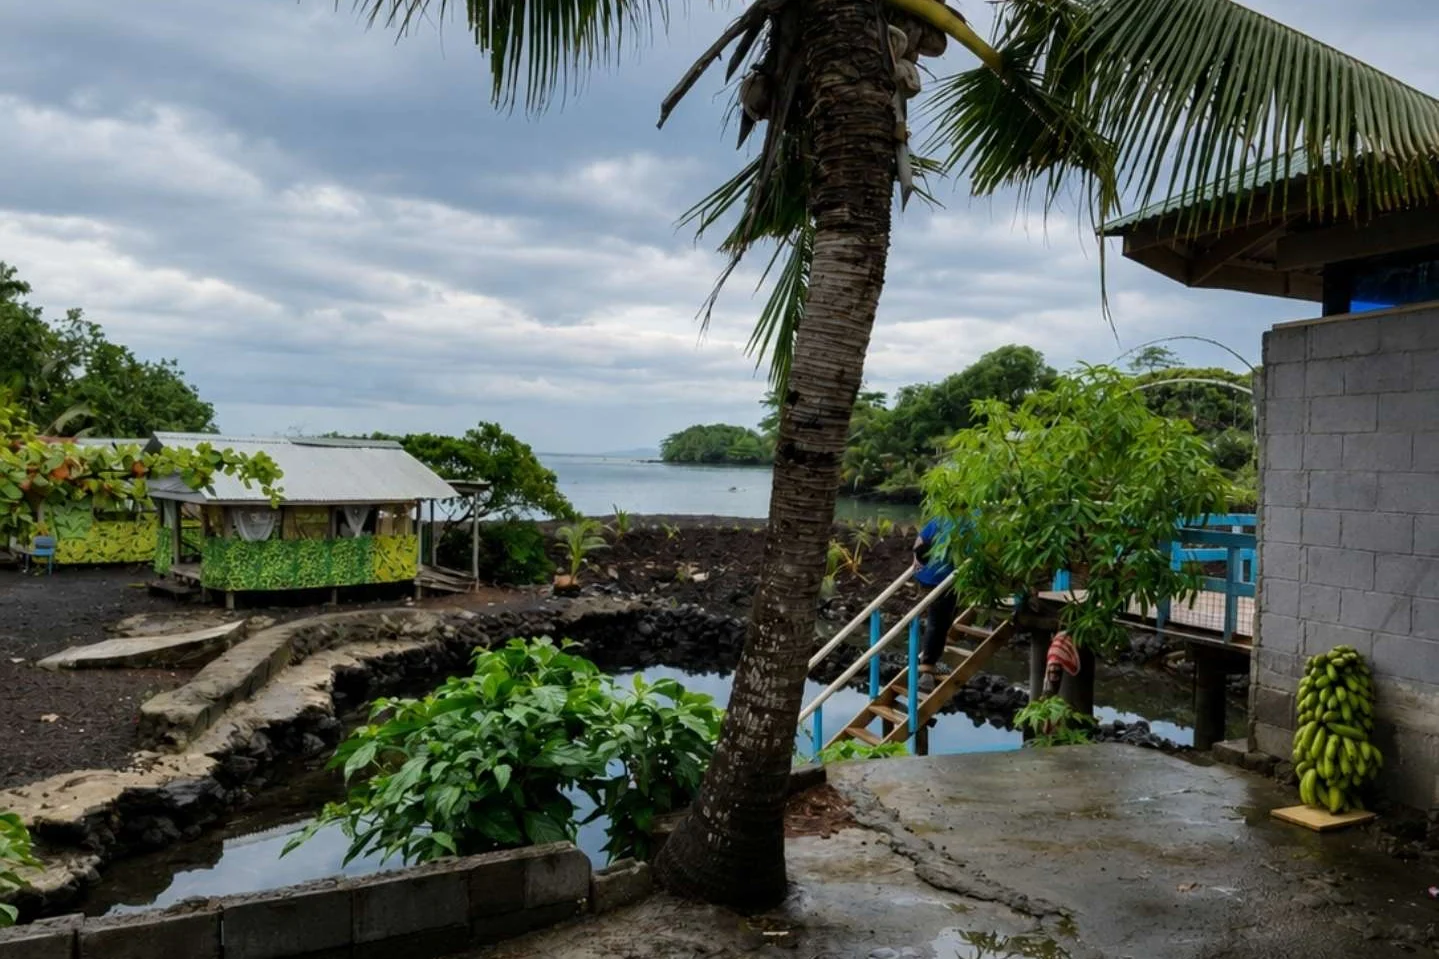
My father is from Vaiafai, Iva, in Savai'i, and much of our aiga still lives there. I grew up in Aotearoa with a Māori mum and a Samoan dad. That connection is where this story begins.
Water is part of how ordinary life is held together: food, travel, gathering and care. The public records here cannot speak for every village, or explain every change. They can show a shift that deserves attention. In 2020, Samoa recorded its highest annual rainfall anomaly. By 2022, only 1998 had been lower.
That is not a story about one village. It is a reason to ask whether plans made for an average year can hold when the year arrives differently.
Source: SPC/Pacific Data Hub rainfall anomaly and EEZ SST anomaly; retrieved 2026-08-17.

ACT 1 · WHEN WATER CHANGES
Water has a rhythm. The records show why it cannot be taken for granted.
In 2020, Samoa's official annual rainfall indicator rose above its reference average. Two years later, it was below it. The records do not explain the change. They show that a plan built for one kind of year may be tested by another.
Samoa-wide official indicator
A wet-to-dry reversal in three annual readings
1991 to 2020 baseline
In three annual readings, +27.3 mm in 2020 became −18.1 mm in 2021 and −20.7 mm in 2022. These are annual Samoa-wide anomalies.
Source: Pacific Community (SPC), Pacific Data Hub .Stat, RAIN_ANOM · Samoa-wide · annual · 1991 to 2020 baseline · frozen derived data.
Samoa EEZ aggregate
The warming ocean is the background condition
1971 to 2000 baseline
2024: +0.8°C in the EEZ annual series. This is not a coastal or inshore temperature record and is not evidence that SST caused a rainfall outcome.
Source: Pacific Community (SPC), Pacific Data Hub .Stat, SST_ANOM · Samoa EEZ aggregate · annual · 1971 to 2000 baseline · frozen derived data.
READ BEFORE INTERPRETING
What these records can and cannot tell us
They can
- show conditions national plans should be tested against;
- make sharp reversals easier to see;
- document one response after a major crop shock.
They cannot
- describe one village, catchment, farm or household;
- show what caused a rainfall or crop outcome;
- choose a local response without local evidence and consent.
ACT 2 · WHEN RAIN ARRIVES ON DIFFERENT TERMS
A seasonal pattern can be familiar without making a particular month predictable.
The near-Upolu grid point has a wet and dry rhythm across the year. A familiar season can still bring an unfamiliar month. Start with an episode, then test another year and month.
Coarse MERRA-2 grid-cell estimate near central Upolu
A within-model monthly average gives orientation, not a local forecast
1981 to 2025 calendar-month record mean
This coarse modelled estimate is used to compare months within the same record. It is not used as local rainfall, a rain-gauge reading or a Samoa-wide estimate.
Source: NASA POWER API, PRECTOTCORR · MERRA-2 grid cell · retrieved 2026-08-18 · API v2.9.7 · frozen derived data.
WATER STRESS TEST
Choose a historical water condition worth testing
Each preset explains why the date matters. Use the year and month controls to explore another condition.
SELECTED EPISODE
April 2016: unusually wet month
What happened
Evidence scope
Planning question
What it cannot determine
Official Samoa-wide or EEZ indicators
National and ocean context
Samoa rainfall anomaly
Not reportedAnnual, Samoa-wide, 1991 to 2020 baselineSamoa EEZ SST anomaly
Not reportedAnnual, EEZ aggregate, 1971 to 2000 baselineModelled grid point near central Upolu
April in 2016
Modelled monthly departure
Not reportedRelative to the same calendar month’s 1981 to 2025 record meanSource: NASA POWER API, PRECTOTCORR · MERRA-2 grid cell at −13.83°, −171.75° · calendar-month departures only · frozen derived data.
Food-resilience history
Taro yield in 2016
Reported taro yield
Not reportedAnnual national/country series, descriptive onlyCoarse MERRA-2 grid-cell estimate near central Upolu
Every month compared with its own record mean
−211 mm drier · 0 · +358 mm wetter
On mobile, use the year and month controls above. The heat map remains available as an overview.
April 2016 is the wettest departure in this 1981 to 2025 grid-point record (+358 mm); February 1998 is the driest (−211 mm). Those are historical modelled values at one grid point, not local impact reports.
Source: NASA POWER API, PRECTOTCORR · MERRA-2 grid cell · 1981 to 2025 calendar-month record mean · frozen derived data.
ACT 3 · FOOD NEEDS OPTIONS
When conditions shift, food systems need more than one way to respond.
The 1993 taro-leaf-blight outbreak was a disease crisis, not evidence of a climate effect. FAO documents a response built around a broader genetic base, regional exchange and on-farm farmer evaluation. That makes the history relevant to adaptation, even though this yield series cannot assign causes by itself.
Food-resilience history
The documented outbreak, the 1994 low and a partial recovery
Annual taro yield · kg/ha
Recorded series: 3,409.1 kg/ha in 1993; 1,500 kg/ha in 1994; 5,000 kg/ha in 2000; 5,574.6 kg/ha in 2024. The series was already falling before the documented outbreak, and 2024 remains below earlier peaks. It describes yield, not causes.
Yield source: Pacific Community (SPC), Pacific Data Hub .Stat, Samoa taro yield · country-level · annual · kg/ha · 1961 to 2024. Outbreak history: FAO taro improvement programme.
A CURRENT POLICY CONNECTION
More options remain part of Samoa’s adaptation agenda.
The blight was not a climate event. It shows why a food system needs more than one option when a major shock arrives.
Samoa’s NDC 3.0 sets a 2035 target to develop and distribute at least three climate-resilient crop varieties adapted to Samoa’s agro-ecological zones. It also states that adoption requires consent from farmers and commercial and community-based farms.
Read Samoa’s NDC 3.0ACT 4 · PLAN FOR THE RANGE, DECIDE IN PLACE
National data can identify the tests. Communities determine the response.
Samoa's NDC 3.0 says Community Integrated Management plans enable each of Samoa's 368 villages to identify locally relevant adaptation measures and draw on local knowledge. This story identifies the pressure. People in place decide what response belongs there.
Stress-test national plans
Test wet years, dry years and unusual months, not one average scenario.
Match evidence to the decision
National, EEZ and grid-point evidence can frame questions. It cannot replace local observations or judgement.
Build adaptive options
Crop diversity, farmer-led trials, community planning, local knowledge and consent are resilience infrastructure.
My family connects me to a Samoa larger than any chart. Water supports the ordinary work of aiga: food, travel, gathering and care. The data cannot tell a village which choice belongs in its place. It can make the pressure visible. The decision stays with the people who live with it.
When water changes, everything changes. Plans need to hold when the year arrives differently, and remain answerable to the people who live with them.
APPENDIXMethods, data and limitations
Pacific climate context
Pacific climate contextNiño 3.4 is retained here as context only. It is not a Samoa rainfall or taro-causation label.
Monthly distribution mechanics
Each box contains 45 observations for the same calendar month. Box = middle 50%; whiskers = 1.5×IQR; dot = median.
How the evidence is located
This map gives island context only. The orange point is the disclosed MERRA-2/POWER monthly model coordinate near central Upolu. The Samoa-wide rainfall, country-level taro and EEZ SST series do not have a local collection point shown here.
MERRA-2/POWER model point near central UpoluSamoa land outline for orientation
Map outline: Natural Earth 10m Admin 0 Countries, public domain; island context only.
Data treatment and limitations
- Missing values remain missing; they are never converted to zero.
- Rainfall, SST, taro yield and Niño 3.4 retain separate units, baselines and spatial scopes.
- No displayed alignment is treated as causal evidence.
- Raw source captures and deterministic transformations are retained in the project repository.
Sources
- SPC/Pacific Data Hub: Samoa rainfall anomaly
- SPC/Pacific Data Hub: Samoa EEZ SST anomaly
- SPC/Pacific Data Hub: Samoa taro yield
- NASA POWER/MERRA-2: monthly precipitation
- NOAA PSL: Niño 3.4 monthly SST
- FAO: The taro improvement programme in Samoa
- Government of Samoa: NDC 3.0
- Pacific Dataviz Challenge 2026 rules